DHS’ 2022 Yearbook of Immigration Statistics
Each year, the Office of Homeland Security Statistics Resources publishes statistics on diverse immigration data, which includes its Yearbook of Immigration Statistics.
According to DHS, “The 2022 Yearbook of Immigration Statistics (2022 Yearbook)is a compendium of tables that provide data on foreign nationals who are granted lawful permanent residence (i.e., immigrants who receive a “green card”), admitted as temporary nonimmigrants, granted asylum or refugee status, or are naturalized. The Yearbook also presents data on immigration enforcement actions, including apprehensions and arrests, removals, and returns.”
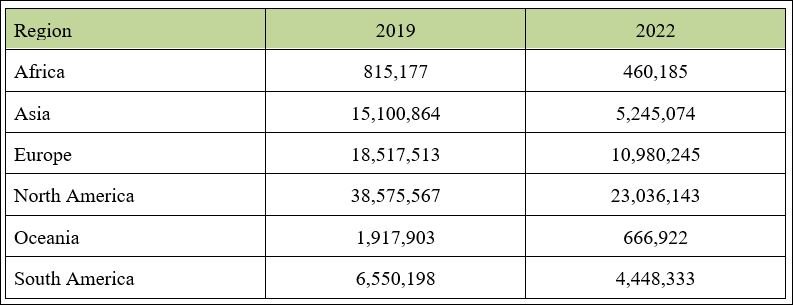
One of the data points that I found most interesting in the 2022 Yearbook is the number and class of nonimmigrant admissions (as recorded by the I-94 system). For example, DHS admitted more than 96 million nonimmigrants in 2022, and while this may seem like a lot, it’s still significantly fewer admissions than our pre-COVID numbers wherein 2018 and 2019, DHS admitted more than 186 million nonimmigrants.
So, who did DHS admitted in 2022? How did these admissions compare to pre-COVID admissions in 2019? Below is an excerpt of some of the visa classifications that I work with the most:
And from which regions did these nonimmigrants come?
Which countries had the most nonimmigrants visit the United States in 2022? Below is a list of the top 10 countries.
Mexico - 13,644,287
Canada - 6,903,580
United Kingdom - 3,090,439
India - 1,793,061
France - 1,469,979
Germany - 1,404,348
Colombia - 1,124,998
Brazil - 1,063,680
Spain - 885,632
Italy - 865,392
Runner-ups include: Argentina, Australia, Chile, South Korea, and the Netherlands, who each had more than 500,000 foreign nationals visit the United States in 2022.
For more insightful data, see DHS’ 2022 Yearbook!

